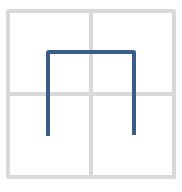
希爾伯特曲線(Hilbert curve)是由 David Hilbert 在 1891 年提出,可以填滿空間的碎形曲線,一階希爾伯特曲線是個通過四個網格中心點的 ⊓ 曲線:
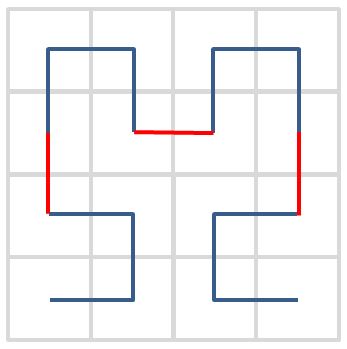
二階是透過將一階的曲線旋轉,畫出四個 ⊓ 曲線並頭尾連接而成:
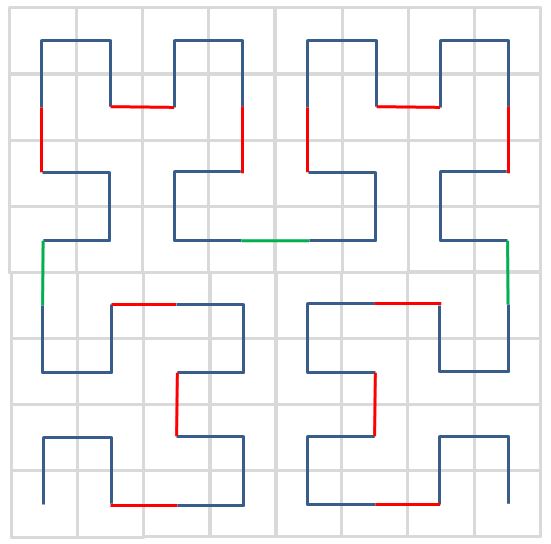
依此類推,三階是透過將二階的曲線旋轉,畫出四個 ⊓ 曲線並頭尾連接而成:
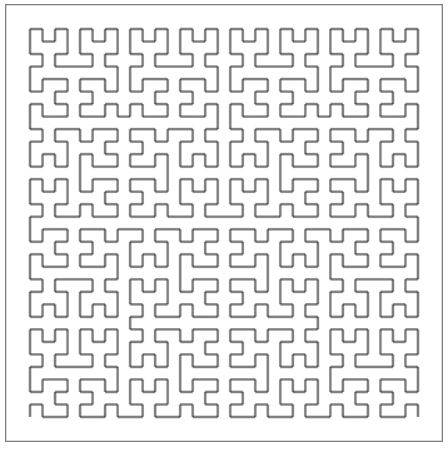
下圖為五階的繪圖結果:
以下是使用 HTML5 Canvas 繪圖的方式:
<!DOCTYPE html>
<html>
<head>
<meta content="text/html; charset=UTF-8" http-equiv="content-type">
<script type="text/javascript" src="js/turtle.js"></script>
<script type="text/javascript">
window.onload = function() {
function hilbert(n, angle, leng, t) {
if(n == 0) {
return;
}
t.turn(-angle);
hilbert(n-1, -angle, leng, t);
t.move(leng);
t.turn(angle);
hilbert(n-1, angle, leng, t);
t.move(leng);
hilbert(n-1, angle, leng, t);
t.turn(angle);
t.move(leng);
hilbert(n-1, -angle, leng, t);
t.turn(-angle);
}
var n = 5;
var leng = 10;
var offset = Math.pow(2, n) * leng / 2 - leng / 2;
var canvas1 = document.getElementById('canvas1');
var context = canvas1.getContext('2d');
var turtle = new Turtle(context);
turtle.window(0, 0, canvas1.width, canvas1.height);
turtle.view(0, 0, canvas1.width, canvas1.height);
turtle.setPoint(175 + offset, 175 - offset);
turtle.setAngle(180);
hilbert(n, 90, leng, turtle);
};
</script>
</head>
<body>
<canvas id="canvas1" width="350" height="350"></canvas>
</body>
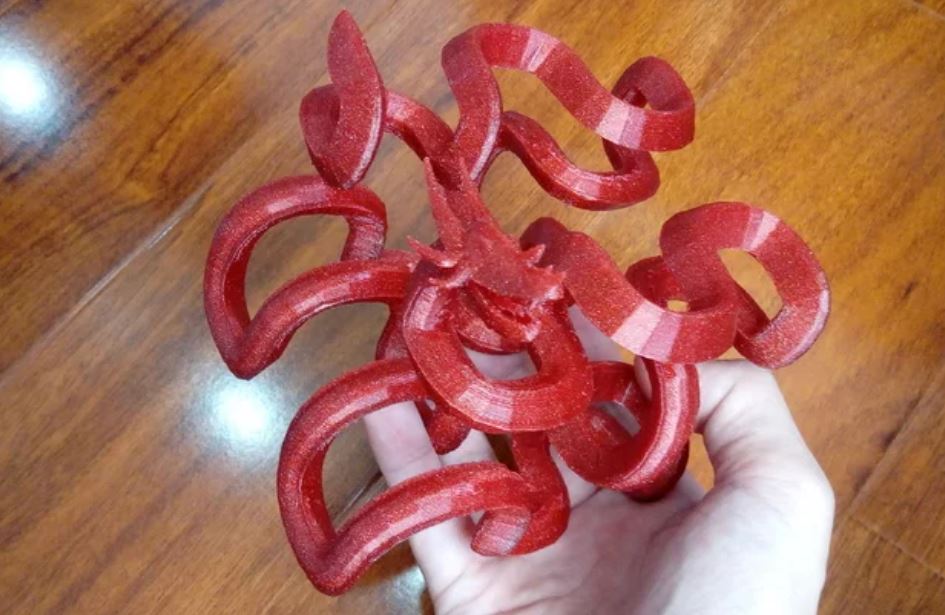
</html>亦有 3D 版本的希爾伯特曲線,下圖是我用 3D 版本的曲線建立的希爾伯特龍: